
“It is easy to assume that LG Energy Solution’s core business has already recovered just by looking at the phrase ”turnaround to profitability in the second quarter.” To start with the conclusion, while the second quarter 2026 results turned into an accounting profit, The core battery business, excluding AMPC, is still operating at a loss....and the stock price outlook depends on the speed of the earnings turnaround of ESS growth.
It is clear that ESS has emerged as a new growth axis amidst the continuing slowdown in demand for electric vehicle batteries. However, since the structure does not dictate that increased orders and revenue immediately lead to improved profit margins, a standard for analyzing the figures is necessary.
To determine if it has turned profitable, look at the profit and loss excluding AMPC first.

LG Energy Solution's revenue for the second quarter of 2026 was 7.5602 trillion won, an increase of 24.81 TP3T from the same period last year and 15.31 TP3T from the previous quarter. Operating profit also improved from a deficit of 207.8 billion won in the first quarter 113.3 billion won surplusWith the transition, the operating profit margin improved from -3.21 TP3T to 1.51 TP3T.
However, this operating profit includes 241 billion won in AMPC, a North American production tax credit. If calculated excluding this, the operating profit/loss for the second quarter is 127.7 billion won deficitIt changes to.
Simply put, the effect of subsidies resulting from increased production at the U.S. factory and the profit from selling batteries must be viewed separately. The net loss for the second quarter also continued at 328.6 billion won, reflecting interest expenses and losses on the disposal of tangible assets.
The turnaround to profitability in the second quarter is the starting point of recovery, but it has not yet reached the stage of generating profit without AMPC.
Look at whether ESS leads to actual profits rather than just revenue growth.
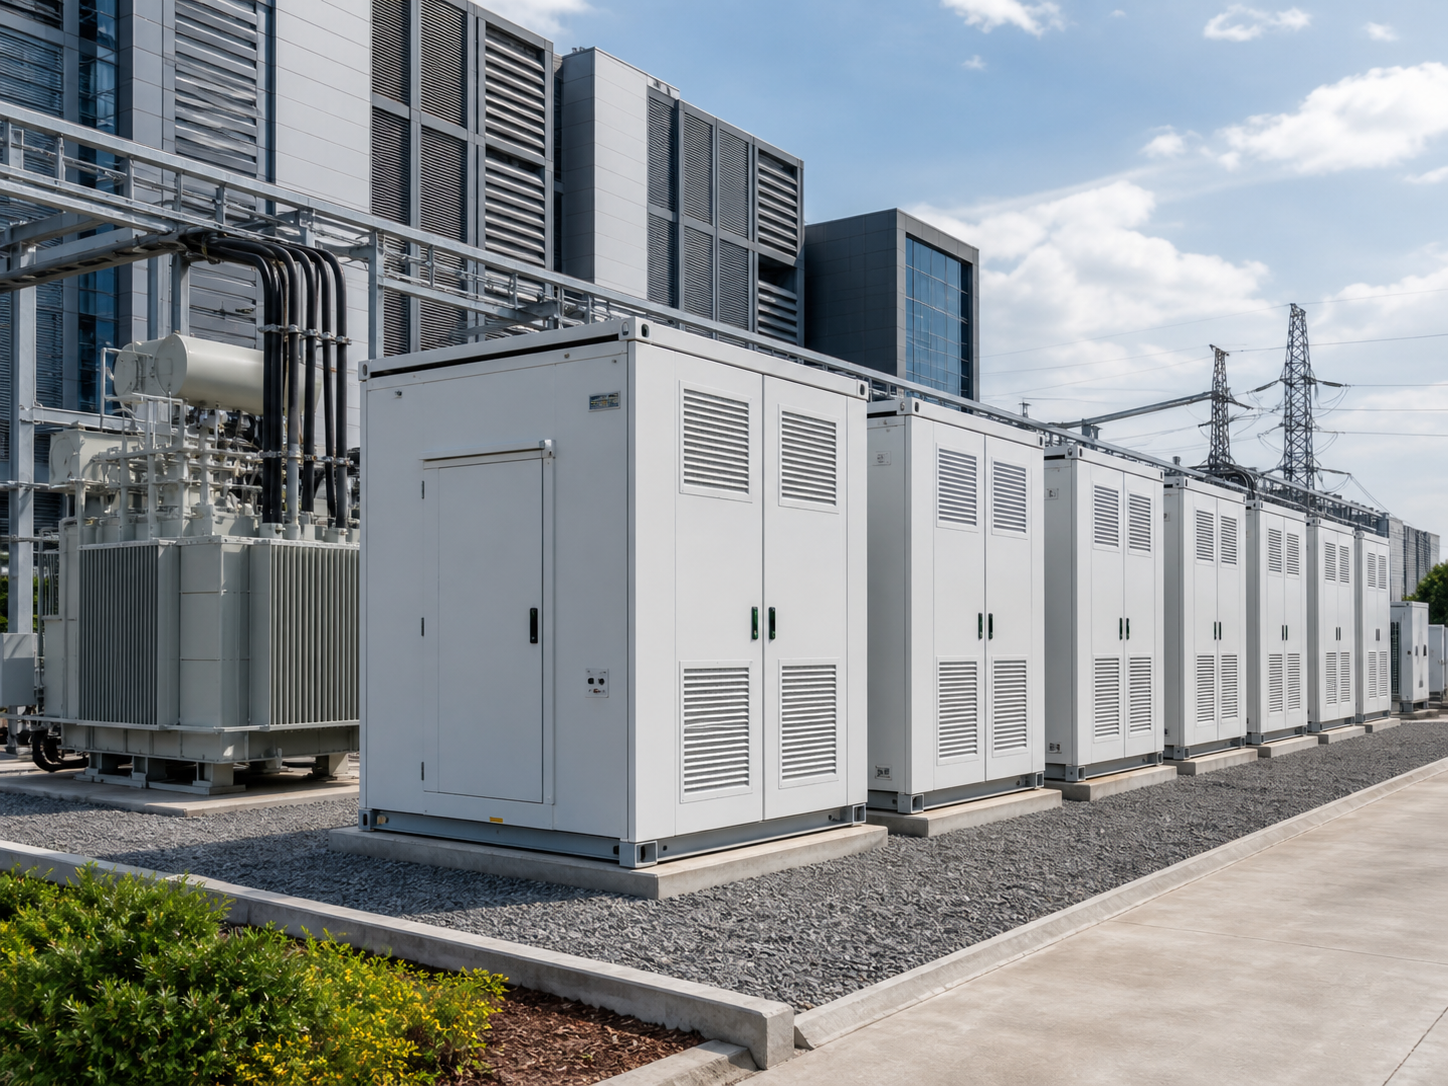
While the electric vehicle battery market remains burdened by falling prices and intensifying competition, the ESS market is showing a different trend. In the first half of 2026, ESS sales increased 4.6-fold compared to the same period of the previous year, and its share of total sales also rose to the high 20% range.
New ESS orders in the first half of the year exceeded 3 trillion won. Although the secured ESS volume reached 140 GWh as of the end of last year, the orders are not recorded as revenue or profit immediately upon contract signing, but rather lead to shipments and revenue recognition over several years.
The expansion of AI data centers is driving large-scale power demand and the need for power grid stabilization. In this context, if increased North American ESS shipments coincide with improved production facility utilization rates, their role in complementing the business structure, which has been EV-centric, will grow.
For the second half of the year, look at shipments and capacity utilization together.

| division | Q2 and First Half of 2026 Trends | Stock price interpretation criteria |
|---|---|---|
| electric vehicle battery | Despite sales recovery, falling prices and competitive pressures persist. | Operating profit/loss and profit margin excluding AMPC |
| North American production subsidies | 241 billion KRW reflected in Q2 AMPC | Separation of accounting profit and core business profit and loss |
| ESS | First-half sales increased 4.6-fold, new orders exceeded 3 trillion won | Shipment timing, order fulfillment, divisional profitability |
| cylindrical battery | 46 Series shipments increased by more than 601 TP3T compared to the previous quarter | Increased capacity utilization and alleviation of fixed cost burden |
Just as important as the growth potential of ESS is the utilization rate of North American factories. In the battery industry, where fixed costs account for a large proportion, the extent of profitability improvement is limited even if production volume increases if factory operations are insufficient.
Shipments of 46-series cylindrical batteries increased by more than 601 TP3T in the second quarter of 2026 compared to the previous quarter. If the expansion of product shipments is a signal of revenue recovery, the next step is the improvement of the operating profit margin reflecting selling prices and costs.
The annual operating profit forecast for 2026 is presented at 728.5 billion won, a decrease of 45.91% from the previous year. On the other hand, the reason for the forecast that operating profit will increase to the 3 trillion won range in 2027 is based on the premise that the fulfillment of ESS orders and the increase in capacity utilization will begin in earnest.
When looking at target stock prices, compare the assumptions rather than the numbers.
The reason the target price range among securities firms has spread widely from 300,000 won to 620,000 won is that they have different timelines. While the average target price was presented in the low 500,000 won range, looking at the single figure in isolation clouds judgment.
The conservative view reflects the slowdown in electric vehicle demand, falling battery prices, and intense competition. Conversely, those suggesting a higher target price base their rationale on demand for ESS driven by the proliferation of AI data centers, expanded production in North America, and the conversion of secured orders into revenue.
The stock price, which fell to 290,500 won during trading on July 29, 2026, rebounded rapidly to the 330,000–340,000 won range in early August. This rebound reflects expectations for the second half of the year, and, The speed of stock price recovery is not the same as the speed of core business profitability recovery.This point is important.
Look at cash and growth axes instead of PER.
With an EPS of -1,643 won, it is difficult to simply compare undervaluation and overvaluation using the PER. In this situation, it is more realistic to examine profit and loss excluding AMPC, the proportion of ESS sales, the speed at which orders turn into shipments, and the cash burden from investments together, rather than focusing solely on revenue growth.
It is also necessary to clearly distinguish the dividend investment perspective. Currently, LG Energy Solution is not paying cash dividends, and no specific timeline for resuming dividends has been provided.
Therefore, the investment logic for this stock is rather than dividend yield. Expansion of ESS and normalization of battery profitabilityIt is positioned in... The forecast that ESS sales will expand to 21.734 trillion won by 2028 and related operating profits will grow to the level of 3.6 trillion won is attractive, but the process is verified by order fulfillment and profit margin improvement.
The first misconception to avoid in the outlook for LG Energy Solution's stock price is interpreting a "surplus including subsidies" directly as a "surplus in core business.".